
What gives? Fed stays hawkish but bond yields fall, equities rise
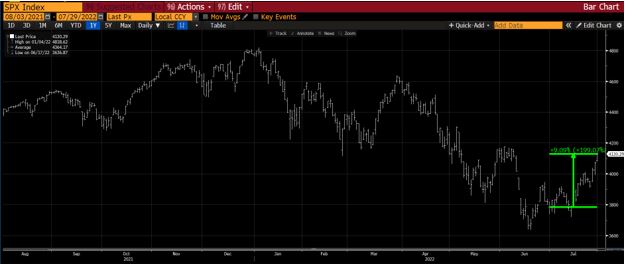
Wow, what a month! Equities go from extremely bearish to up 9% for the month, while bond yields fall. Given the divergence views between bonds and equities, something has to give.
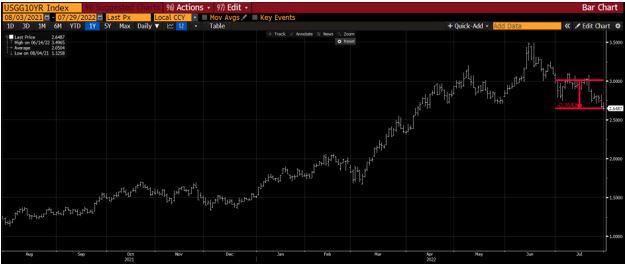
The Fed remained hawkish during the July meeting, but traders were having none of it, despite continued multi-decade highs in inflation. Yields on the US Treasury 10 Year fell 36 basis points during July as investors begin to price in an economic slowdown. Recall that the 10 Year was nearly 3.5% a month and a half ago. Bond managers have switched from inflation fear to recession fear.
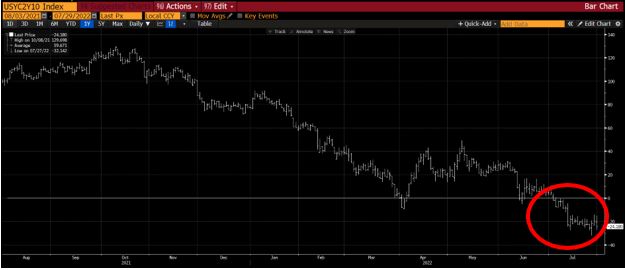
This is best evidenced by the 2 Year – 10 Year yield curve which has now been inverted (short-term yields higher than long-term yields) for a month, typically a recession signal.
But while the bond market begins to price in a recession, equities rallied 9.1% in July! There are a number of reasons for this.
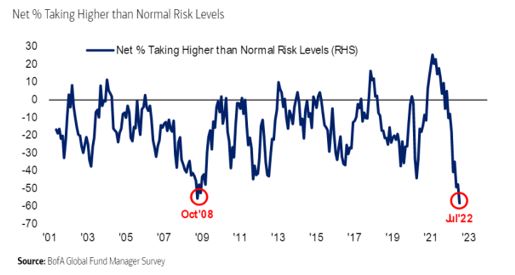
First, equity investor sentiment was so bad that it could not go any lower (Exhibit 4). In fact, institutional investors were taking less risk than during October of 2008 during the Great Financial Crisis! Basically, there were no sellers left. Investors were braced for bad news from the Fed and corporate earnings, both of which largely delivered. But the news was not worse than expected, providing the opportunity for a relief rally.
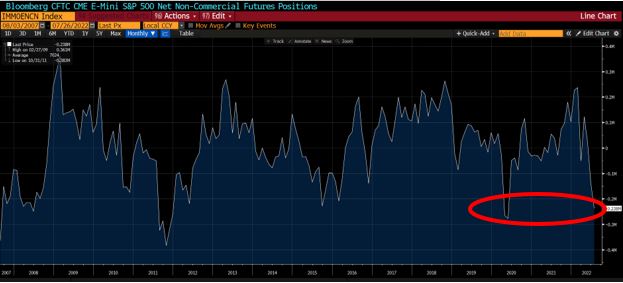
Second, too many investors were short of the market (and may still be). As seen in Exhibit 5, net CFTC futures (a measure of net bets for and against the direction of the S&P 500) were back to the levels seen during the early days of the pandemic crisis. With all these investors short, once the market turned around many are forced to buy (to cover their short).
Are you interested in making portfolio changes or getting a more in-depth analysis? Contact Stableford today by calling 480.493.2300 or simply request a copy of our Market Blast.
This market commentary was written and produced by Stableford Capital, LLC. Content in this material is for general information only and not intended to provide specific advice or recommendations for any individual. All performance referenced is historical and is no guarantee of future results. All indices are unmanaged and may not be invested in directly. The views stated in this letter are not necessarily the opinion of any other named entity and should not be construed directly or indirectly as an offer to buy or sell any securities mentioned herein. Due to volatility within the markets mentioned, opinions are subject to change without notice. Information is based on sources believed to be reliable; however, their accuracy or completeness cannot be guaranteed. Past performance does not guarantee future results.
S&P 500 INDEX: The Standard & Poor’s 500 Index is a capitalization-weighted index of 500 stocks designed to measure the performance of the broad domestic economy through changes in the aggregate market value of 500 stocks representing all major industries.