
Stableford Capital— August Review
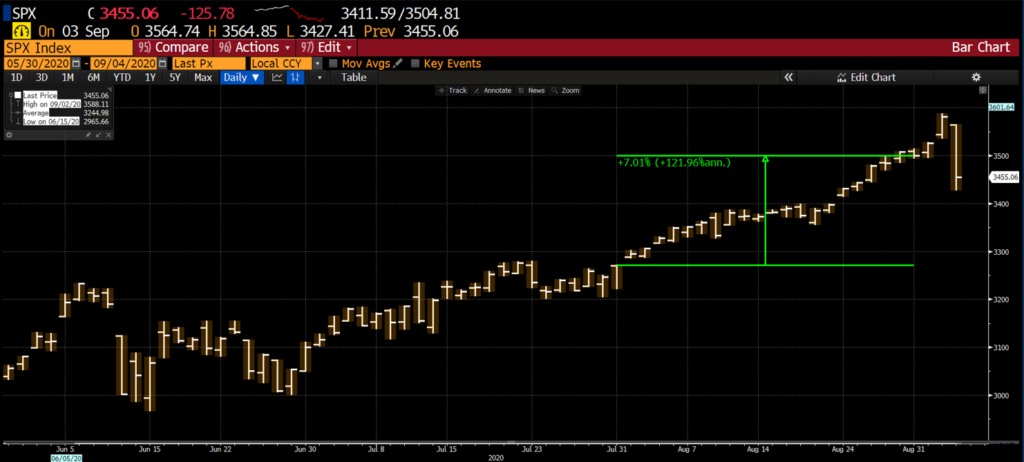
The S&P 500 was up 7% in August (Figure 1), continuing its relentless upward move. Though many long-toothed market-watchers sense how ridiculous the move upward this summer is given lofty valuations, high levels of economic uncertainty, and an uncanny resemblance to 1999-2000 tech market euphoria (when yours truly took a company public with ZERO revenues, no joke), it has not mattered. Unlimited liquidity from the Fed can do that, bubbles be damned.
But someone needs to be prudent, even if the government isn’t. That’s our job at Stableford. If the dry-cleaner in town was offered for $100K last week but now they are asking $200K, it doesn’t mean it is a good deal, especially if the underlying cash flow could never justify the valuation. Owning equities is no different, as they are simply small ownership pieces of corporations. The price action of stocks does not always represent the true long-term value of a business. This type of dislocation is what is going on in tech stocks during the summer of 2020.
But wait, as of today (September 3) we had our first correction in two months with the S&P 500 down 3.5% and the tech-heavy Nasdaq off nearly 5%. Traders have come to realize that perhaps the emperor has no clothes: Much of the recent climb is the result of speculative demand in call options. It’s all a bit wonky, but suffice it to say if enough dealers write call options (the equivalent of being short a stock), and the market goes up, the dealers need to buy to hedge / cover their positions.
Of course, the more the market goes up from the buying, the worse the problem becomes. It is a circular ever-escalating game of chicken. Until it isn’t. One day does not make a trend. But it will be interesting to see how this plays out. The charts below help to explain.
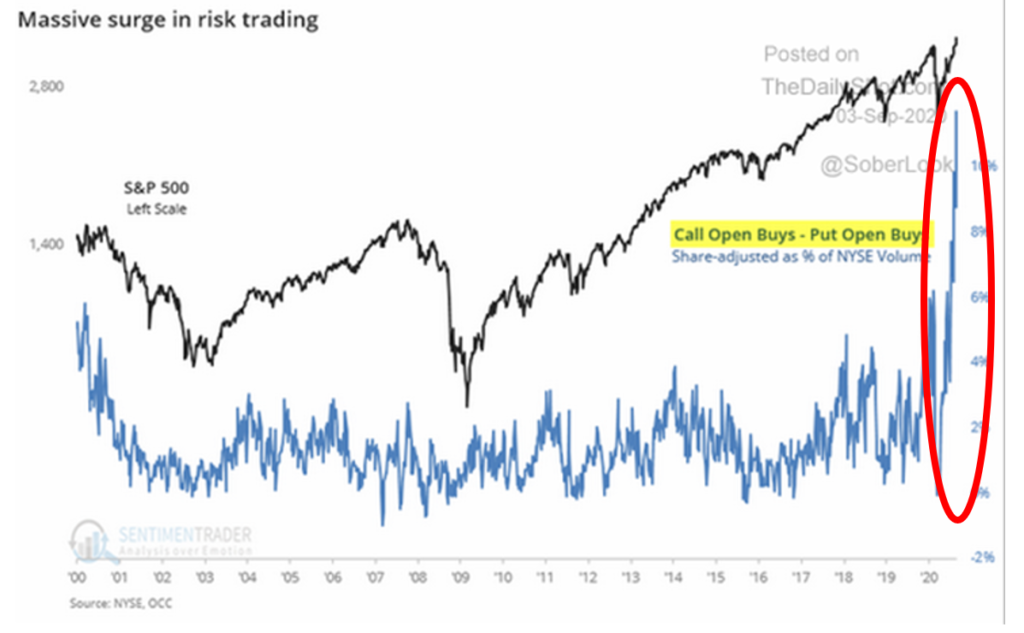
In Figure 2, we can see that the net open call buys are at their highest level in the last 20 years—by a long shot. This represents all the equities that need to be bought at some point if the price gets too close to the actual strike price of the option (i.e. panic buying as the stock price approaches the option strike price).
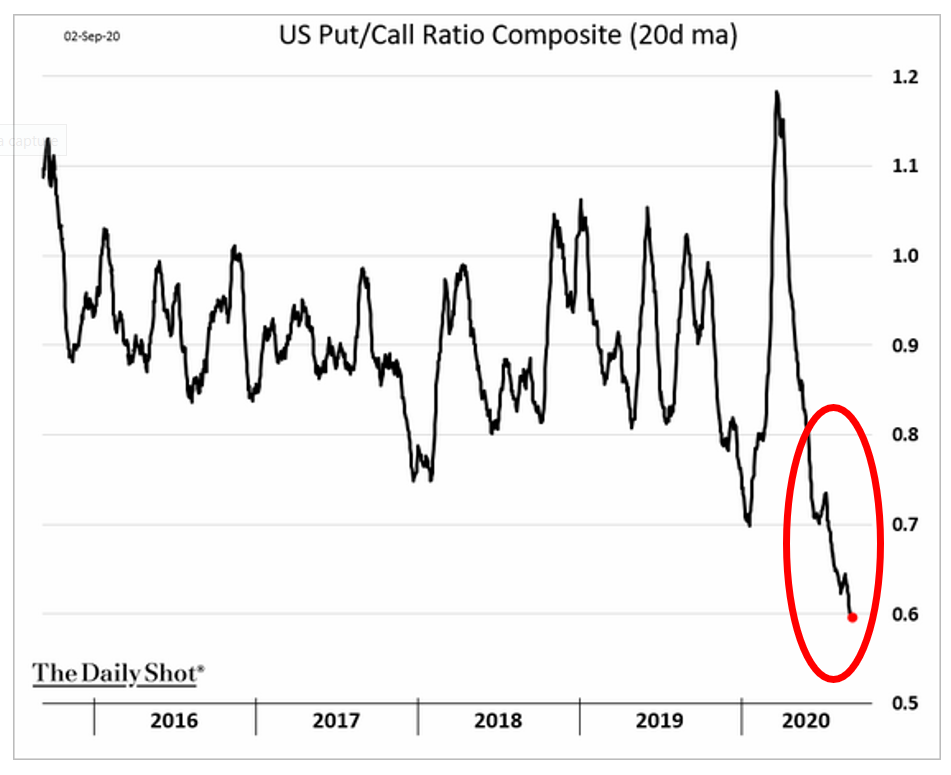
Another helpful chart is Figure 3 which shows the Put / Call Ratio. This statistic measures the ratio of traders betting on markets increasing (calls) vs. decreasing (puts). A lower number indicates a skew towards calls, meaning there are a lot of calls outstanding. As the market goes up, the dealers who sold those calls need to buy stock to offset their short position. We are at extreme levels which helps to explain the relentless and mechanical feeling to the buying of late. It’s rare that the market moves up for 2 months without a hitch nor any regard for valuation.
Stableford’s Positioning
So, what does this all mean? Extreme positioning in options markets drives buying, which in turn drives more buying and on and on. But at some point, everyone buys what they need, or a bunch of sellers step in as they realize what the game is. That appears to be what happened today.
Despite what is happening in the headlines, we continue to like our holdings which tend toward a value bent with overweight positions in sectors such as finance, REITs, and a little bit of energy.
On the fixed-income side, 10 Yr US Treasury rates moved up from 0.53% to 0.71% in August. This is the first monthly move higher this year (though it wasn’t particularly large). Much of it was driven by the extremely low levels of July, but also the start of fear regarding inflation and the belief that the economy is improving. It is worth noting that rates have re-traced roughly half the August move in September on a flight to quality and a small reversal in dollar weakness.
Be well!
Are you interested in making portfolio changes or getting a more in-depth analysis? Contact Stableford today by calling 480.493.2300 or simply request a copy of our Market Blast.
This market commentary was written and produced by Stableford Capital, LLC. Content in this material is for general information only and not intended to provide specific advice or recommendations for any individual. All performance referenced is historical and is no guarantee of future results. All indices are unmanaged and may not be invested in directly. The views stated in this letter are not necessarily the opinion of any other named entity and should not be construed directly or indirectly as an offer to buy or sell any securities mentioned herein. Due to volatility within the markets mentioned, opinions are subject to change without notice. Information is based on sources believed to be reliable; however, their accuracy or completeness cannot be guaranteed. Past performance does not guarantee future results.
S&P 500 INDEX: The Standard & Poor’s 500 Index is a capitalization-weighted index of 500 stocks designed to measure the performance of the broad domestic economy through changes in the aggregate market value of 500 stocks representing all major industries.